How to Inspect Element in Safari
You can use the Inspect Element feature to view and manipulate a website’s front-end. Web developers, designers, or marketers often need to inspect web elements to debug elements, conduct layout tests, or do CSS editing like fonts, colors, etc. This article explains how to inspect web elements on the Safari browser on your Mac.
The Inspect Element feature is a handy tool that enables you to see a website’s inner workings so that you can see what’s really happening in the background.
Enable Inspect Element in Safari
The first step is to enable Inspect Element. Here is how:
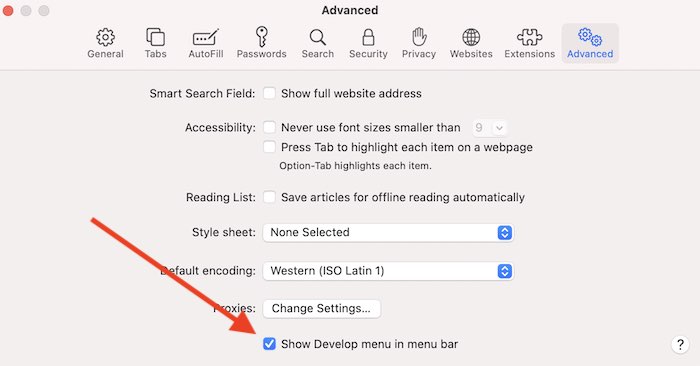
- In Safari, click Safari and Preferences.
- Click the Advanced tab.
- Select the “Show Develop menu in menu bar” box.
Open Inspect Element
There are a few ways to access Inspect Element so that you can start changing, adding, and removing page elements:
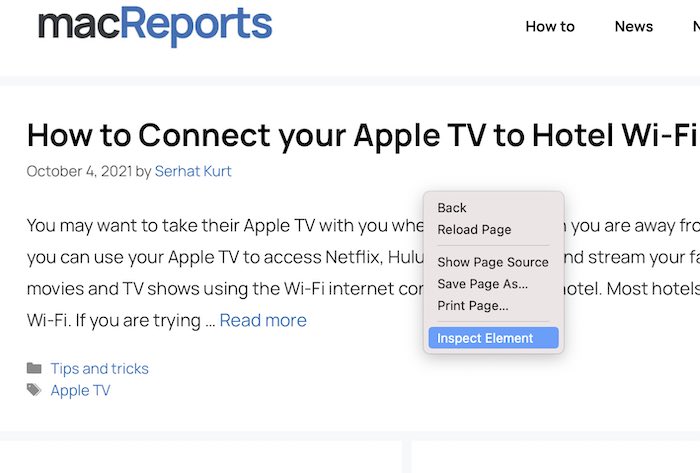
1. Using your mouse or trackpad, right-click (control-click) anywhere on the webpage and select “Inspect Element”
2. You can use the Develop menu. In Safari, click Develop and choose “Show Web Inspector”.
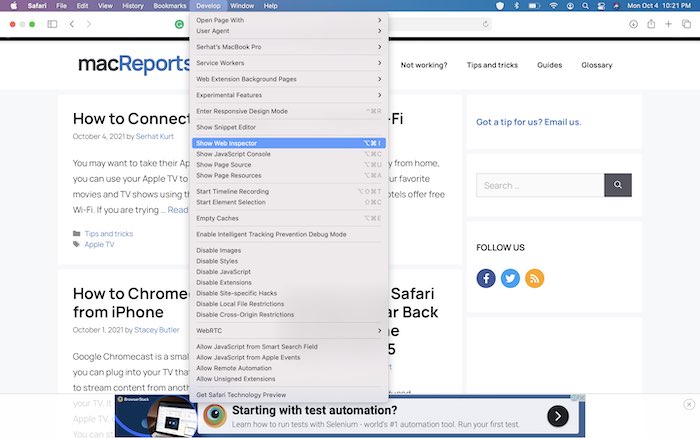
3. You can also use keyboard shortcuts. Simply press these keys together: Option-Command-i.
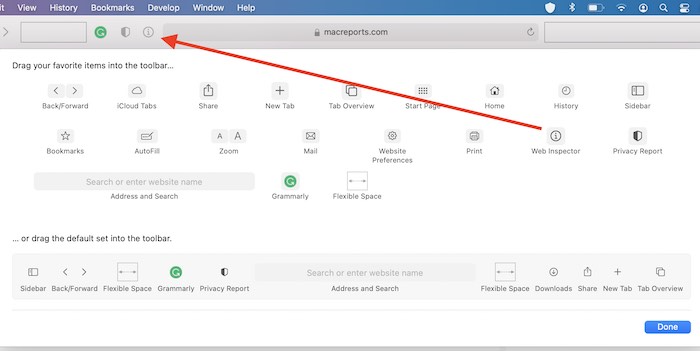
4. And lastly, you can customize the Safari toolbar to add the Web Inspector icon for easy access. Here is how:
- In Safari, click View > Customize Toolbar.
- Using your mouse or trackpad, drag the Web Inspector icon into the toolbar.
Use Inspect Element
Safari’s Inspect Element will open in a pane at the bottom of the screen.
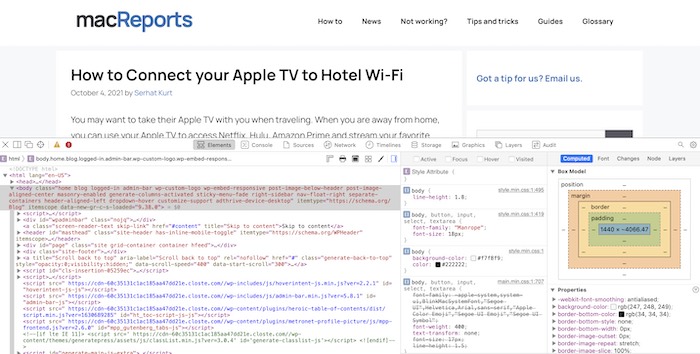
You have a few options:
- Click the “Dock to side of window” icon to move the pane to the right side of the window.
- Click the “Detach into separate window” icon to open the pane in a separate window.
- To close the Inspect Element page, click the close (X) icon.
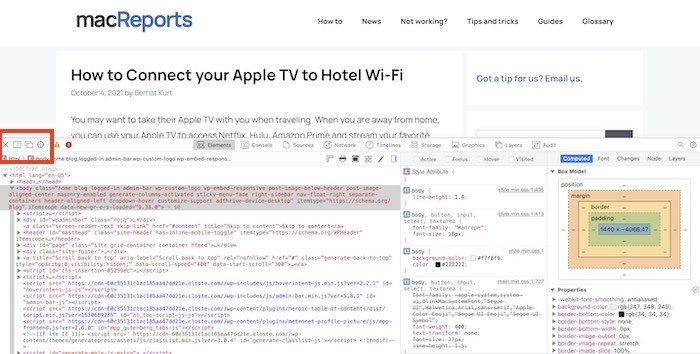
Along the top of the panel, you will see tabs:
- Elements: This is the main screen. This shows all of the page code (HTML, CSS, Javascript etc) and other details such as the page’s grid system.
- Console: This shows error messages. It is a warning log.
- Sources: This shows the page’s HTML code.
- Network: This shows a detailed list of the requests made to and from the server.
- Timelines: This shows a visual analyzer that includes all of the activity such as network requests, Javascript, or memory.
- Storage.
- Graphics.
- Layers.
- Audit.
If you click the gear settings icon, you can customize the pane. For example, you can select a dark or light theme.
See also:


