Activity Monitor: What It Is & How To Use It (Task Manager)
Activity Monitor is the macOS version of the task manager that is found in all versions of Microsoft Windows computers. Activity Monitor shows a variety of processes in use, in real-time. So that you can view each of the processes running on the computer, and see how they affect the overall performance of your computer. Activity Monitor also lets you see hidden background processes.
Activity Monitor is a utility app included in macOS. If you were/are a Windows user, it can be said that Activity Monitor is Mac’s Task Manager.
You can use Activity Monitor to troubleshoot your problems. For example, sometimes your Mac gets slow, your Mac stuck on a white screen, or your Mac displays a black screen. Activity Monitor may help you diagnose your problem.
If you think that Activity Monitor is not functioning properly, please see this article.
How to open Activity Monitor
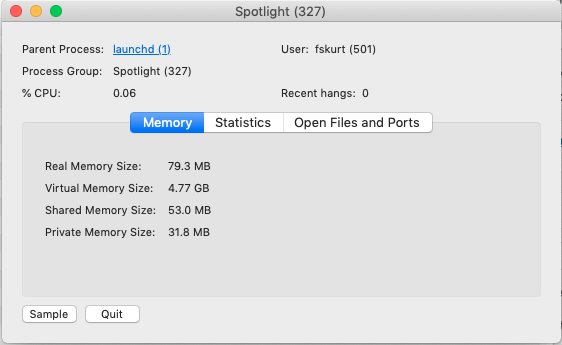
You can access Activity Monitor by going to the Utilities folder of your Applications folder (Applications > Utilities). Or you can use Spotlight to open it. Simply press the Command and Space keys and type activity monitor.
How to use
There are five categories:
- CPU
- Memory
- Energy
- Disk
- Network
- Cache
And you will see that under each category, there is a list of entries that keeps changing every few seconds.
You can monitor your computer to check whether anything is using too much memory, CPU, etc or misbehaving.
You may force close applications or processes from Activity Monitor. You may want to do this if your Mac becomes unresponsive. You may want to close down CPU-hungry processes. Simply double click on the application or the process and then click the Click button (or choose the application and then click the “X” button in the top left corner). Please do not quit processes or applications if you are not sure. Some may not be safe to quit.
You may want to terminate frozen and unresponsive apps or websites. If you terminate an app, you may lose unsaved data.
The CPU tab
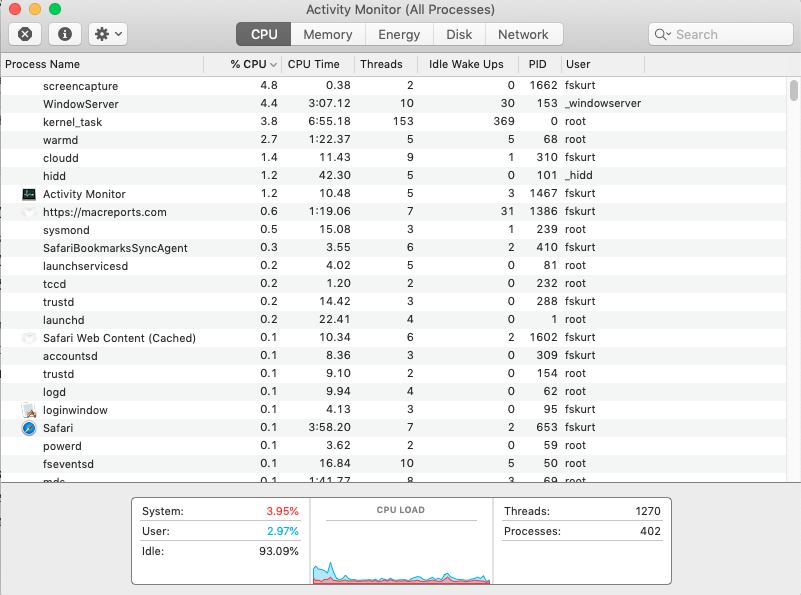
This tab shows your computer’s CPU (processor) activity. You will see more information at the bottom:
- System: You will see a percentage there. This shows the percentage of current CPU use. This CPU usage belongs to macOS.
- Iddle: This is the percentage of current CPU that is not being used.
- User: This shows the percentage of current CPU usage. This use belongs to apps you opened.
- CPU load (graph): This shows how much the processor is working.
- Threads: Total number of threads.
- Processes: Total number of processes.
The Memory tab
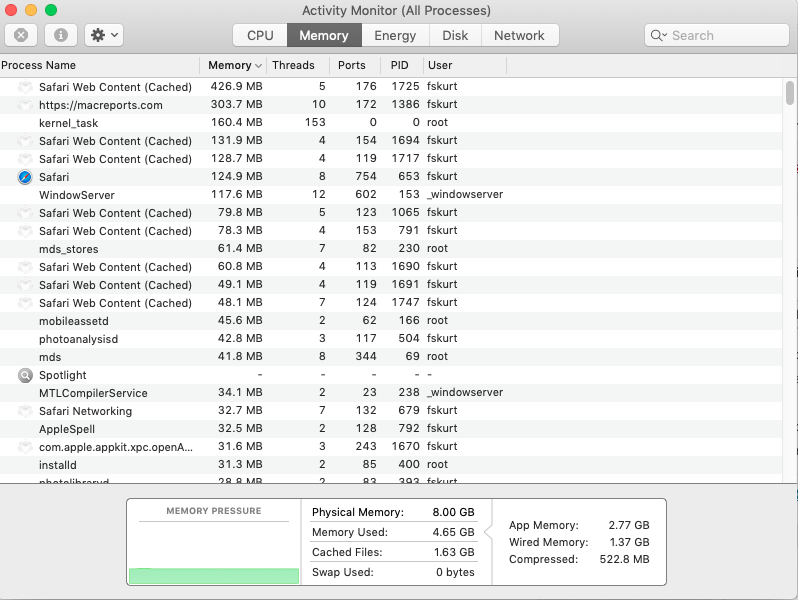
This tap lets you see how memory is being used. Like the CPU tab, more information is available at the bottom:
- Memory Pressure (graph): This shows the availability of memory resources. Green means memory resources are available, red means memory recourses are depleted, yellow means memory resources are available but they are being used by memory management processes.
- Physical Memory: Your computer’s RAM.
- Memory Used: Total amount of memory currently used. This has three subcategories: App Memory, Wired Memory and Compressed.
- Cached Files: Total amount of memory that is recently used but now available.
- Swap Used: Total amount of memory used on the startup drive by memory management.
The Energy tab
This tab lets you view your computer’s overall energy use.
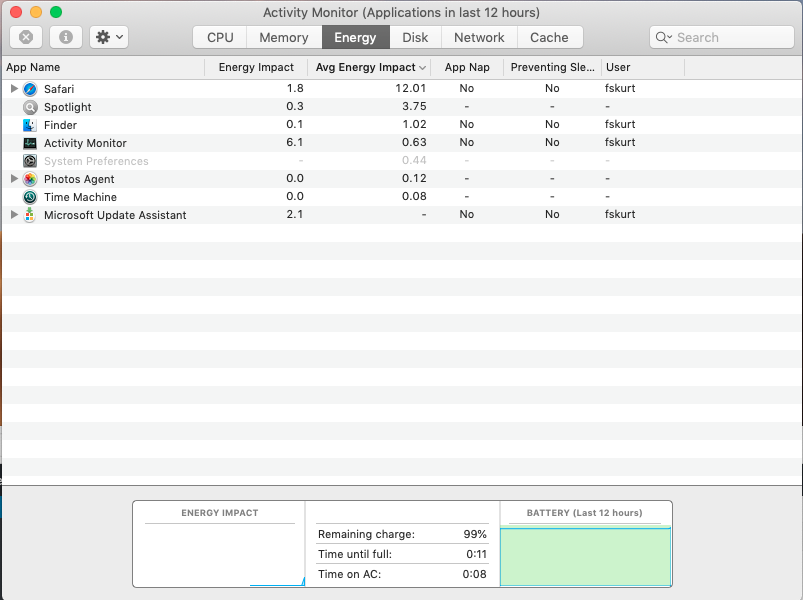
Just like the other tabs above, more information available:
- Energy Impact (graph): The total amount of energy used by all apps.
- Graphics Card: The type of graphic card you are using.
- Remaining Charge: The remaining battery life.
- Time Remaining: The battery time remaining.
- Time on Battery: The time since you unplugged your device from the power source.
- Battery (Last 12 hours): The last 12 hours battery charge level.
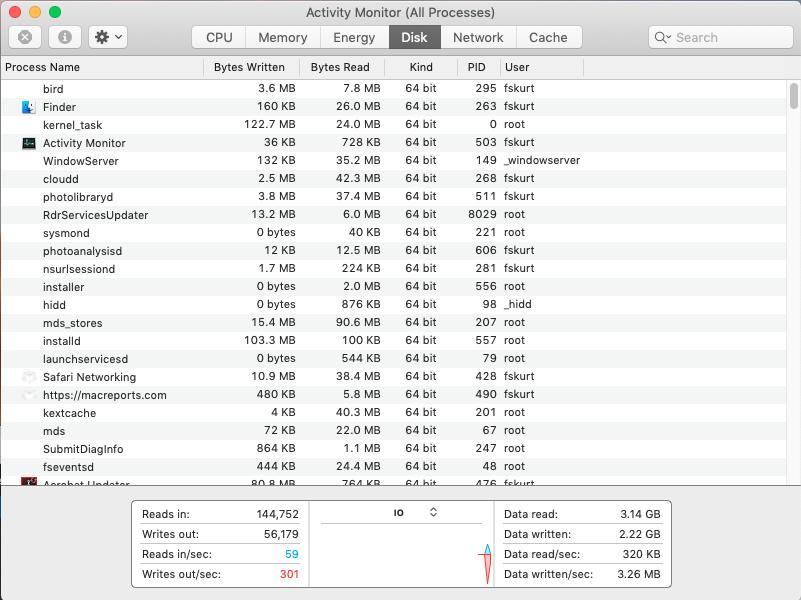
The Disk tab
This tab lets you see the amount of data that each process reads (reads in) and writes (writes out). You can also see a disk activity graph in your Dock. If you want to do this, go to View > Dock Icon > Show Disk Activity.
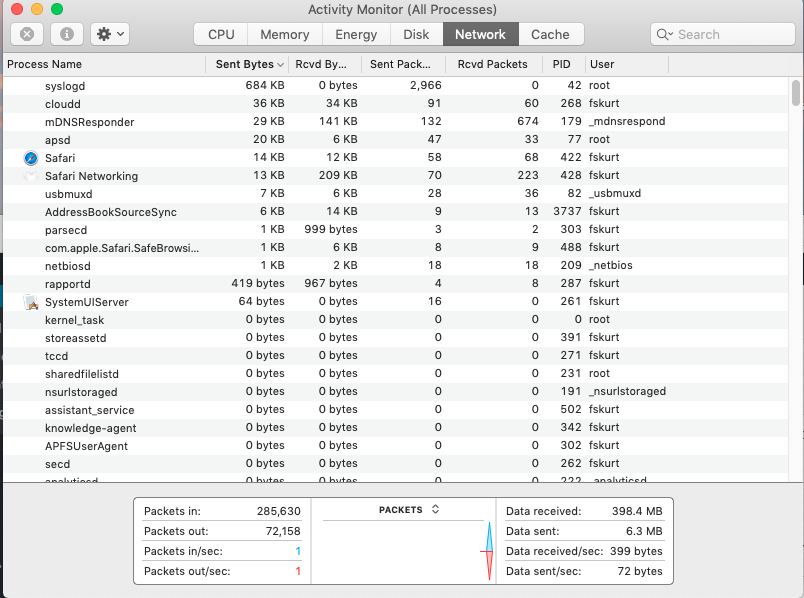
The Network tab
This lets you see how much data your computer is receiving and sending. Like the disk activity, you can show a network activity graph in your Dock by going to View > Dock Icon > Show Network Usage.
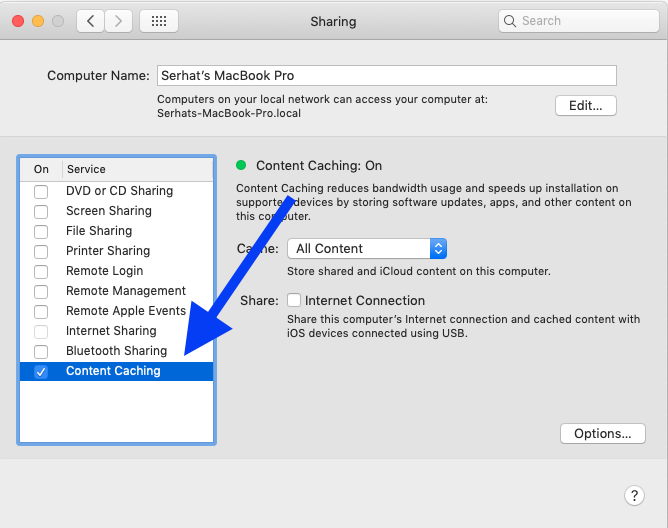
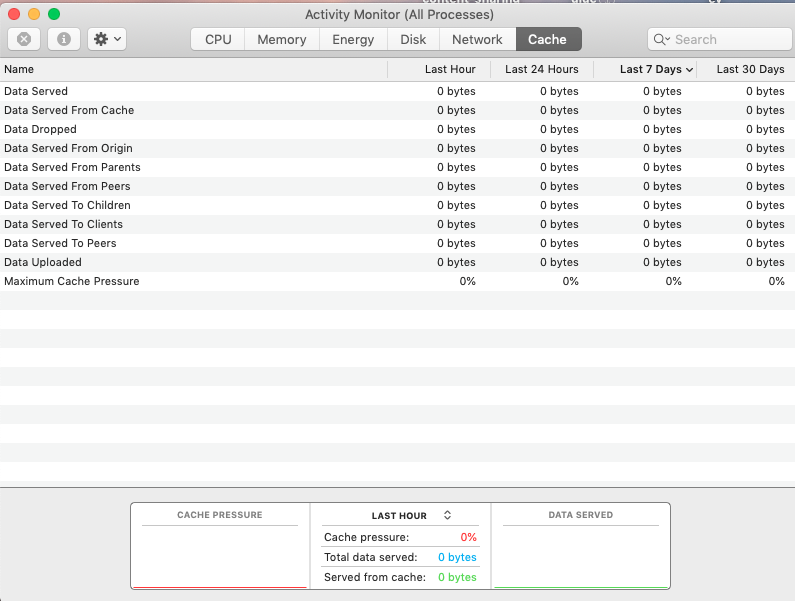
The Cache tab
If your computer is running macOS High Sierra 10.13.4 or higher, then you will have this tab also, if content caching is turned on.
To enable this feature, go to System Preferences > Sharing and select Content Sharing. You will need to restart your computer after turning this on. As you can see enabling content caching will reduce bandwidth use.
 This tab lets you see how much-cached content uploaded or downloaded.
See also: How To Use Terminal On Your Mac

The CPU values do not appear to add up correctly. In the example shown in the CPU Tab above, in the bottom pane the total of System & User CPU is 6.91% with 93.09% Idle, which reconciles. However, the top four processes alone in the table have a total of 15.7% CPU usage suggesting that the total of System & User CPU should be much more than shown in the bottom pane.
What is the difference between the %CPU column in the table and the %CPU in the bottom pane? It does look pretty random to me – is this a case of comparing Apples to Pears?
omg thank you so much the terminal code worked perfectly you are a gem!